|
Total regular season attendance for Major League Baseball in 2017 was 72,670,423.
It's important to note that attendance numbers are based on tickets sold, not tickets actually used. Because the tally is not based on the turnstile count, the total and average attendance reported by each team at their ballpark does not accurately reflect the number of people who actually attended games.
Also, averages are computed by dividing the total by "dates," a designation that is used instead of "games" since not all teams, due to doubleheaders and occasional other reasons, have 81 home game dates in a season (in 2017, 22 of 30 teams did).
There were 11 single-admission doubleheaders in 2017. So the total number of home dates (2,419) for all major league ballparks was 11 less than the possible 2,430.
The average number of tickets sold per date in the 2017 season was 30,042. Games were played in the normal 30 MLB ballparks, plus there was a special occasion game played in a minor league park in Williamsport, Pennsylvania -- the "Little League Classic" -- which was originally scheduled for PNC Park, hence it counted as a Pirates home game.
In the two tables below, teams are sorted by highest to lowest average attendance within their league. Ballpark capacities are from the Ballpark Directory at Baseball Pilgrimages. To see the dates of each ballpark's highest and lowest single-game attendance, hover over/tap any of those particular figures.
American League
34,363,609 tickets sold for 1,207 games in 17 ballparks (28,470 average)
| Team | Total | Dates | Average | High | Low | Ballpark (Capacity) |
| New York Yankees | 3,146,966 | 79 | 39,835 | 47,883 | 25,566 | Yankee Stadium (49,642) |
| Toronto Blue Jays | 3,203,886 | 81 | 39,554 | 48,456 | 28,401 | Rogers Centre (48,292) |
| Los Angeles Angels | 3,019,583 | 81 | 37,279 | 44,807 | 25,304 | Angel Stadium (45,050) |
| Boston Red Sox | 2,917,678 | 81 | 36,021 | 37,570 | 32,072 | Fenway Park (37,493) |
| Texas Rangers | 2,507,760 | 81 | 30,960 | 48,350 | 19,027 | Globe Life Park (48,114) |
| Houston Astros | 2,390,678 | 78 | 30,650 | 41,950 | 18,362 | Minute Maid Park (40,963) |
| Detroit Tigers | 2,321,599 | 81 | 28,662 | 45,013 | 21,237 | Comerica Park (41,681) |
| Kansas City Royals | 2,220,370 | 80 | 27,755 | 40,019 | 17,727 | Kauffman Stadium (37,903) |
| Seattle Mariners | 2,135,445 | 81 | 26,364 | 46,197 | 13,799 | Safeco Field (47,116) |
| Minnesota Twins | 2,051,279 | 80 | 25,641 | 39,615 | 15,171 | Target Field (39,504) |
| Cleveland Indians | 2,048,138 | 81 | 25,286 | 35,002 | 14,184 | Progressive Field (35,400) |
| Baltimore Orioles | 2,028,424 | 81 | 25,042 | 45,667 | 11,142 | Camden Yards (45,971) |
| Chicago White Sox | 1,629,470 | 79 | 20,626 | 39,422 | 10,842 | Guaranteed Rate Field (40,615) |
| Oakland A's | 1,475,721 | 80 | 18,447 | 40,019 | 9,329 | Oakland Coliseum (47,170) |
| Tampa Bay Rays | 49,510 | 3 | 16,503 | 21,024 | 13,159 | Citi Field (41,922) |
| Tampa Bay Rays | 1,204,109 | 77 | 15,638 | 31,042 | 6,509 | Tropicana Field (31,042) |
| Houston Astros | 12,993 | 3 | 4,331 | 6,123 | 3,385 | Tropicana Field (31,042) |
|
|
National League
38,306,814 tickets sold for 1,212 games in 16 ballparks (31,606 average)
| Team | Total | Dates | Average | High | Low | Ballpark (Capacity) |
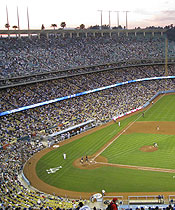
| Los Angeles Dodgers | 3,765,856 | 81 | 46,492 | 53,701 | 35,448 | Dodger Stadium (56,000) |
| St. Louis Cardinals | 3,447,937 | 81 | 42,567 | 48,052 | 36,250 | Busch Stadium (46,861) |
| San Francisco Giants | 3,303,652 | 81 | 40,786 | 42,862 | 37,797 | AT&T Park (41,503) |
| Chicago Cubs | 3,199,562 | 81 | 39,501 | 42,186 | 32,905 | Wrigley Field (41,160) |
| Colorado Rockies | 2,953,650 | 81 | 36,465 | 49,169 | 20,504 | Coors Field (50,398) |
| Milwaukee Brewers | 2,558,722 | 81 | 31,589 | 44,709 | 19,062 | Miller Park (43,000) |
| Washington Nationals | 2,524,980 | 81 | 31,173 | 42,744 | 18,881 | Nationals Park (41,546) |
| Atlanta Braves | 2,505,252 | 81 | 30,929 | 41,627 | 19,971 | SunTrust Park (41,500) |
| New York Mets | 2,460,622 | 80 | 30,758 | 44,384 | 19,617 | Citi Field (41,922) |
| San Diego Padres | 2,138,491 | 81 | 26,401 | 43,441 | 14,224 | Petco Park (42,445) |
| Arizona Diamondbacks | 2,134,375 | 81 | 26,350 | 49,016 | 12,215 | Chase Field (48,633) |
| Philadelphia Phillies | 1,905,354 | 79 | 24,118 | 45,121 | 15,154 | Citizens Bank Park (43,651) |
| Pittsburgh Pirates | 1,916,851 | 80 | 23,961 | 36,484 | 11,027 | PNC Park (38,362) |
| Cincinnati Reds | 1,836,917 | 81 | 22,678 | 43,804 | 10,586 | Great American Ball Park (42,271) |
| Miami Marlins | 1,651,997 | 81 | 20,395 | 36,519 | 14,390 | Marlins Park (37,442) |
| Pittsburgh Pirates | 2,596 | 1 | 2,596 | 2,596 | 2,596 | Bowman Field (2,474) |
|
|
2017 Attendance Facts & Footnotes
Severe weather forced the relocation, on short notice, of a pair of three-games series that were to be hosted, respectively, by the Astros and Rays. For the Astros, Hurricane Harvey caused their August 29-31 series against the Rangers to be moved from Houston's ballpark to Tropicana Field, with the announcement of the move coming on August 28. The three Astros "home" games at the Rays' dome collectively drew 12,993 with all tickets sold priced at $10. As for the Rays, Hurricane Irma was responsible for having to relocate their September 11-13 home series against the Yankees away from Tropicana Field and to New York, where the games were played at Citi Field instead of Yankee Stadium, which was not available due to non-baseball event bookings. The movement of the Rays-Yankees series to the Mets' ballpark was announced on September 8 and 49,510 tickets, at a cost of $25 each, were sold to what were officially counted as Tampa Bay home games.
The Pirates played one home game at the minor league ballpark in Williamsport, Pennsylvania to inaugurate the MLB Little League Classic, which from 2017 forward will be an annual game played there in August during the Little League World Series. The Pirates hosted the Cardinals on August 20, 2017 in the first Classic played at BB&T Ballpark at Historic Bowman Field, so named because the Williamsport park opened in 1926. Officially the 4th oldest and 8th smallest (2,474 capacity) of the 159 minor league ballparks in use during the 2017 season, Bowman Field is 195 miles northeast of PNC Park, where the final game of what was a four-game series between the Pirates and Cardinals was to be originally played. The formation of the Little League Classic and corresponding relocation of the game from Pittsburgh was announced on March 9 and attendance for it was mostly limited to the participating players, coaches and family members of the Little League World Series teams as there were no public ticket sales. Given the tiny capacity of the venue, the announced Classic crowd of 2,596 was the smallest to see a major league game during the 2017 regular season.
Including their home games played elsewhere, the Astros drew 2,403,671 for all of their home dates (78 in Houston and 3 in St. Petersburg, FL), the Pirates drew 1,919,447 for all of their home dates (80 in Pittsburgh and 1 in Williamsport), and the Rays drew 1,253,619 for all of their home dates (77 in St. Petersburg and 3 in Flushing, NY).
18 of 30 teams had their largest home crowd of the season in their home opener. The average attendance in 2017 for all teams' first home game was 42,650. Appropriately, the ballpark with the largest capacity, Dodger Stadium, had the largest attendance for a home opener (53,701) and the majors' smallest venue by capacity, Tropicana Field, had the smallest opening day crowd (31,042).
11 traditional doubleheaders were played, with ten being the result of games postponed by weather while the Rays hosted the A's in a scheduled doubleheader (which was the first scheduled two-gamer in MLB since July 16, 2011). With their official attendance listed in parentheses, the single-admission DHs in 2017 were:
- Astros-Yankees on May 14 at Yankee Stadium (47,883)
- Royals-Twins on May 21 at Target Field (27,852)
- Tigers-White Sox on May 27 at Guaranteed Rate Field (26,327)
- A's-Rays on June 10 at Tropicana Field (17,775)
- Mariners-Royals on August 6 at Kauffman Stadium (29,432)
- Twins-White Sox on August 21 at Guaranteed Rate Field (14,493)
- Marlins-Phillies on August 22 at Citizens Bank Park (20,761)
- Braves-Phillies on August 30 at Citizens Bank Park (15,706)
- Indians-Yankees on August 30 at Yankee Stadium (39,598)
- Astros-A's on September 9 at Oakland Coliseum (19,244)
- Braves-Mets on September 25 at Citi Field (21,698)
Not including the Atlanta Braves, there wasn't a team that set a season-high or season-low attendance record at their present ballpark in 2017, which was the Braves' first season at SunTrust Park, thus ensuring that their inaugural year total of 2,505,252 would be the ballpark's initial all-time high and low. At the team's previous stadiums, the Braves hit high marks of 3,884,720 at Atlanta-Fulton County Stadium (in 1993) and 3,464,488 at Turner Field (in 1997). Their lowest season totals at each venue were 534,672 (Atlanta-Fulton County Stadium in 1975) and 2,001,392 (Turner Field in 2015). |

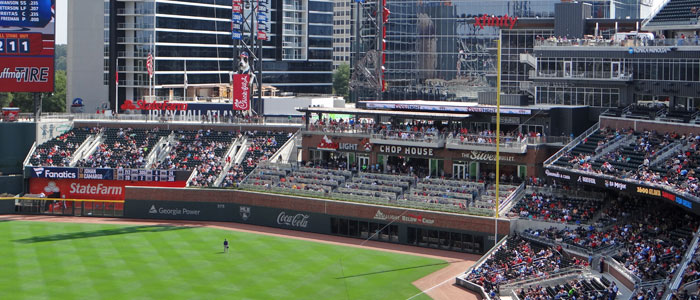
The Braves opened a new ballpark in 2017 and it was drastically different in many ways from where the team played before. Besides its differing look and location, SunTrust Park has many less seats than Turner Field did, as the suburban Braves ballpark is smaller in capacity by 8,086. In fact, Atlanta's Turner Field was the majors' 4th largest ballpark by official capacity (49,586) in 2016, whereas Cobb County's SunTrust Park (capacity: 41,500) ranked 20th in its inaugural season. |
|


